Contents · Previous: Pipeline · Next: API Explorer
Costs
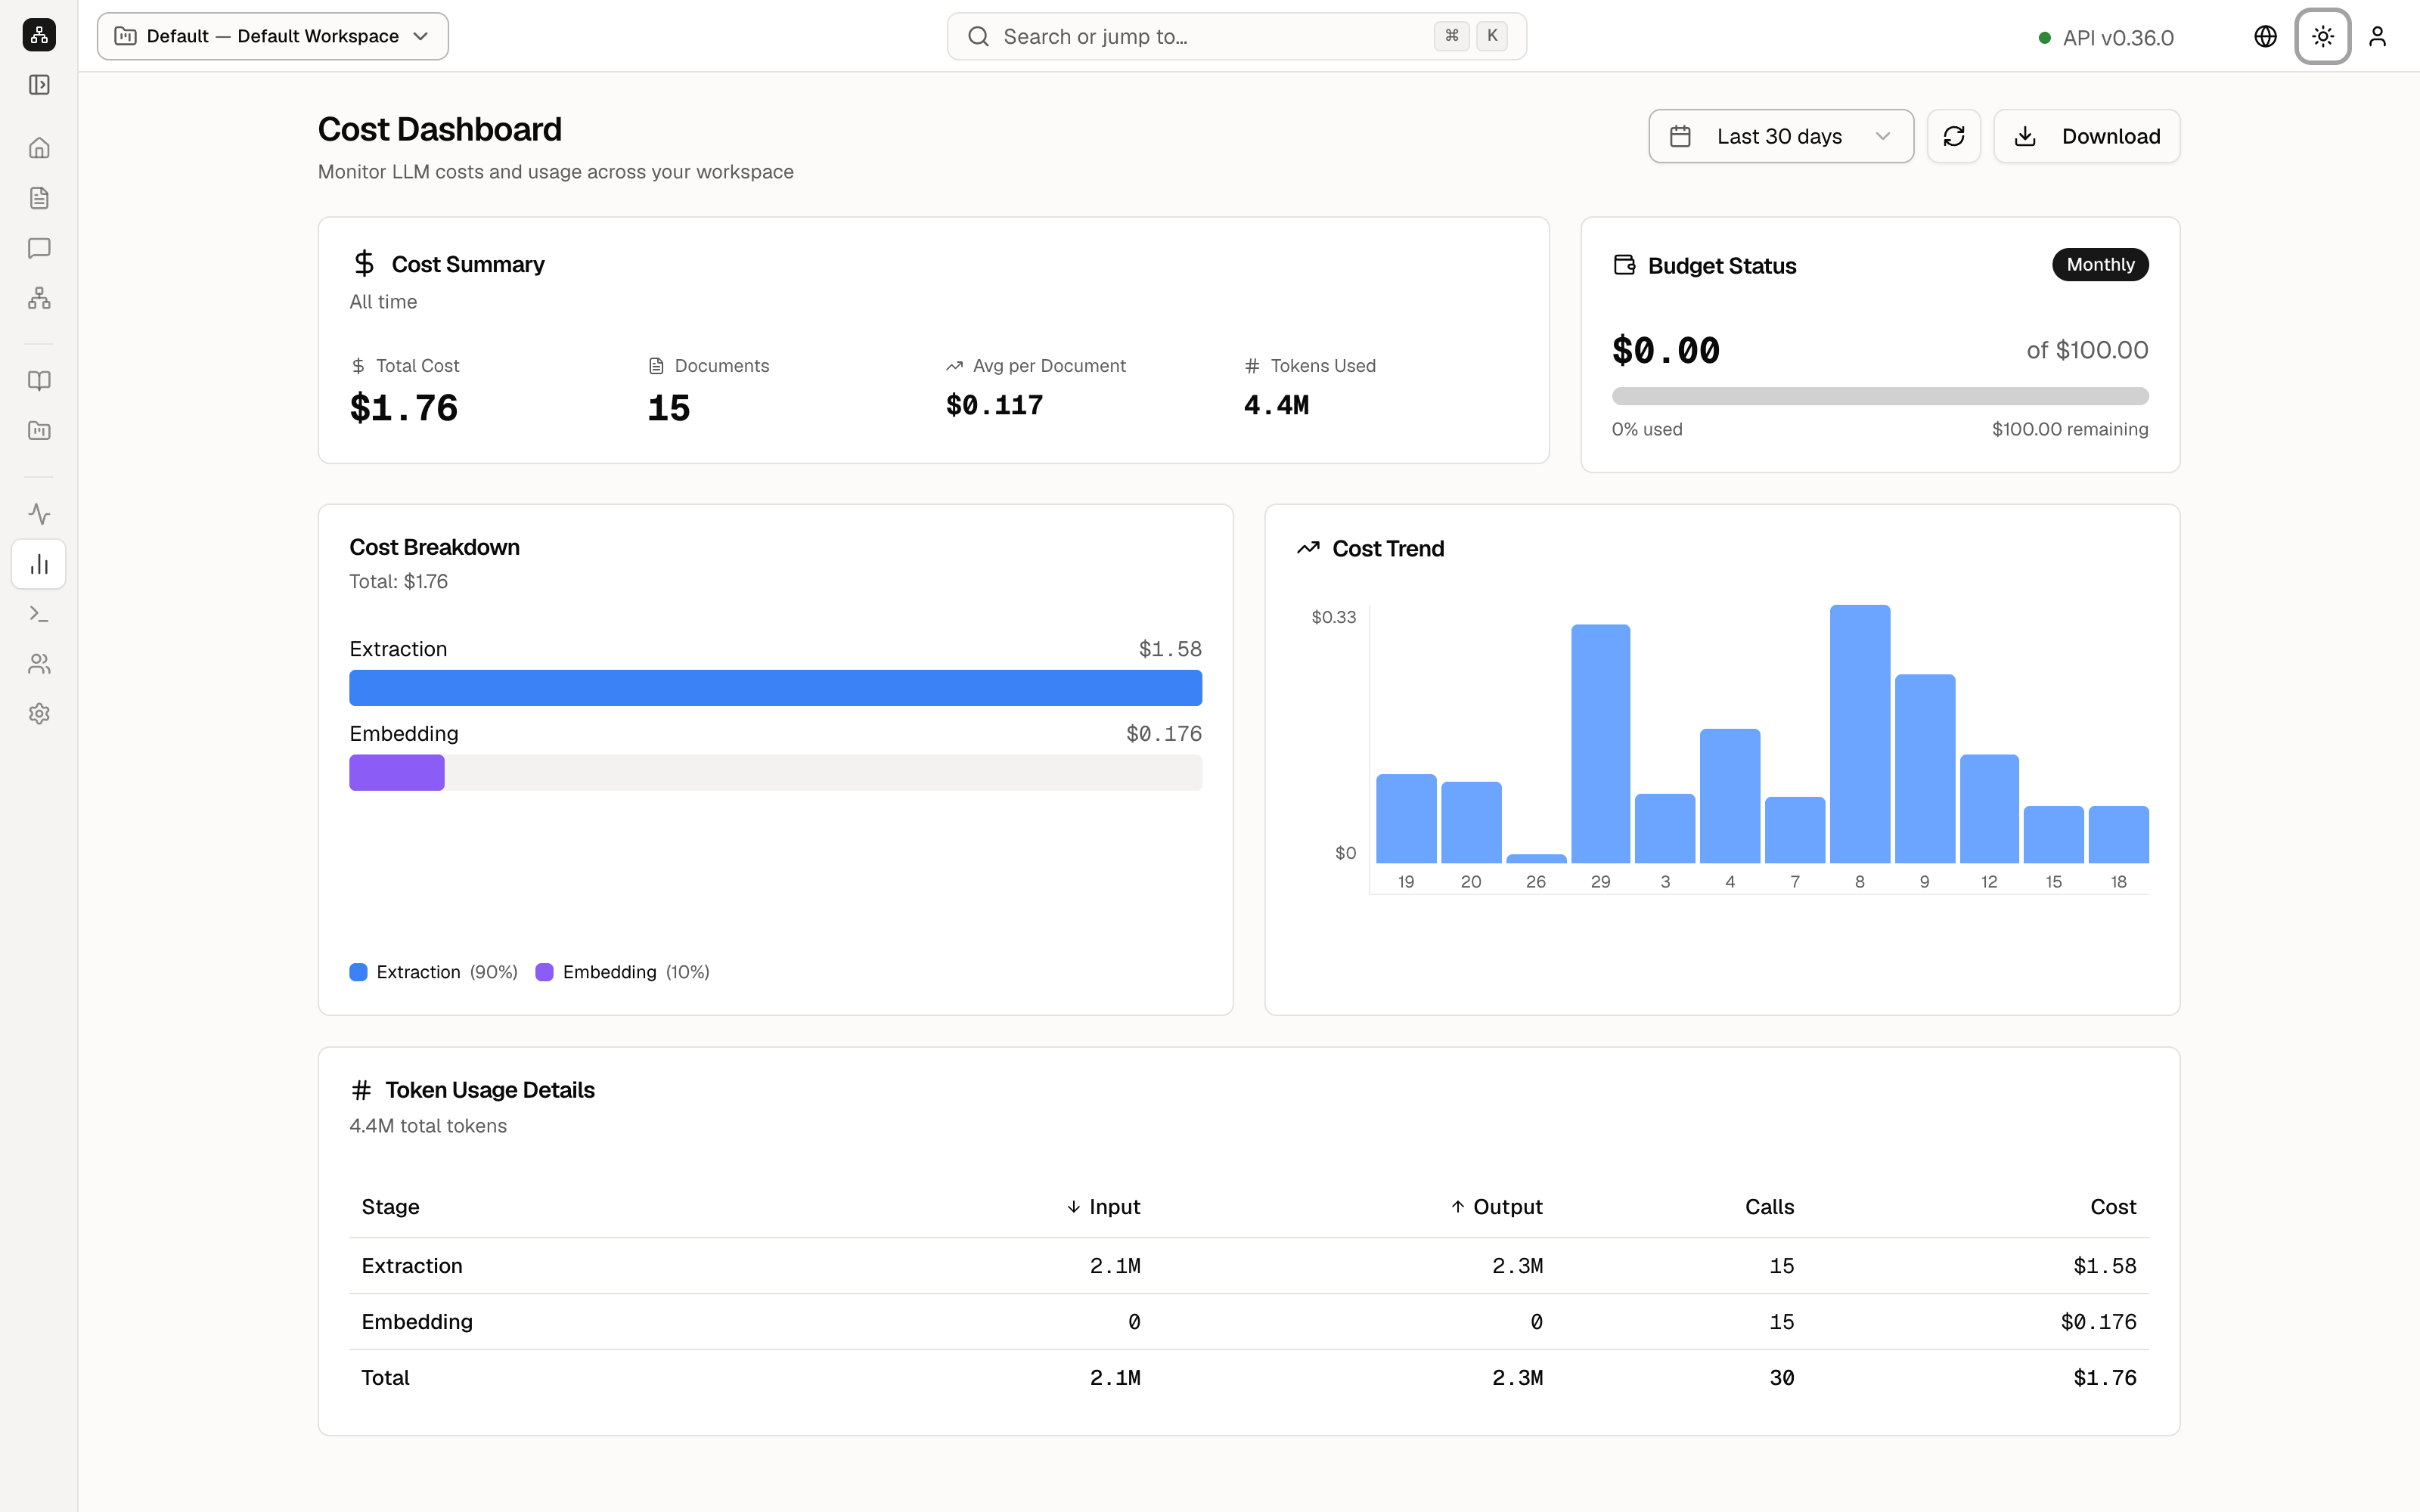
Costs is the bill for model calls in this workspace. Reading a file and answering a question both call a model, and both show up here.
The title is Cost Dashboard. The subtitle on the screen is Monitor LLM costs and usage across your workspace. LLM is the language model: the program that reads files and writes answers.
Last 30 days is the range for the trend chart. The refresh icon reloads the numbers. Download saves the table.
The summary
Cost Summary, labeled All time, has four figures for this demo:
- Total Cost $1.76
- Documents 15
- Avg per Document $0.117
- Tokens Used 4.4M
A token is a small piece of text the model is billed on. A short sentence is a handful of tokens. 4.4 million is the sum of everything sent in and everything the model wrote back.
Budget Status is a monthly cap. It shows $0.00 of $100.00, 0% used, and $100.00 remaining. The Monthly pill and Resets in tell you the cap is per month. The $1.76 in the summary is all-time spend, so it can be higher than the month-to-date number in the budget card. On this day the current month had not added new spend.
Where the money went
Cost Breakdown, total $1.76:
- Extraction $1.58, the blue bar, about 90%. This is the work of reading files and listing entities.
- Embedding $0.176, the purple bar, about 10%. This is the work of turning chunks into vectors.
Cost Trend is a chart of spend across days. The labels along the bottom are dates. A flat chart means little new work in that window.
The token table
Token Usage Details says 4.4M total tokens. The columns are Stage, Input, Output, Calls, and Cost.
| Stage | Input | Output | Calls | Cost |
|---|---|---|---|---|
| Extraction | 2.1M | 2.3M | 15 | $1.58 |
| Embedding | 0 | 0 | 15 | $0.176 |
| Total | 2.1M | 2.3M | 30 | $1.76 |
Input is text sent to the model. Output is text the model returned. Embedding shows zeros in the token columns and still shows a cost, because that provider bills the vector step differently. Calls is how many times that stage ran: 15, once per document, and 30 in total.
These figures belong to the public demo. Your own workspace will show your own bill.
Keep going
Next: API Explorer. The queue that generates most of this bill is Pipeline.